Stuff to what…?
Not too long ago, a colleague introduced me to Gource. In case you have not heard of Gource before, I highly suggest you take a few minutes and check out the project home page here. If you have been developing, or are part of a development project that has been around a while, then Gource should be able to tell you a tale in a strangely mesmerising way about its progression. Go ahead, download and install it. You are going to need it to try the rest of the stuff anyways.
Be warned though, watching the output is highly addictive and strangely entertaining, so if you value your productivity, don’t continue reading this post.
In short, Gource will take your repos commit logs from Git, Mecurial, SVN or even CVS (with some work) and splash out a graphical representation of the commits, by committer, across time. It also has a number of tweaks that allows you to change some visuals, focus on specific comitters and add titles etc.
You can also create a Gource ‘movie’ by specifying the -o option for output. This will provide a sequence of screenshots in PPM format that can later be encoded using something like FFMPEG. Keep in mind that this output is massive. 5mins of output generated something like a 5GB .ppm file for me. You can also just pipe your Gource output directly into ffmpeg, skipping the need to create the .ppm as FFMPEG can read a stream. I of course have no idea how you’d accomplish this in Windows, but ok ;D
Majong released a video of exactly this for the Minecraft dev tree. 800+ days worth of work, depicting the commit logs from a alpha 1.2 version through to the 1.5 release bought down 8 minutes. Direct Link
Taking it one step further.
So all this is cool and stuff. Watching the stories of code get told in a uber cool fashion, causing a lot of productive time to be lost. However, browsing through the Gource Wiki Pages, revealed a rather interesting section. Gource accepts a argument called --log-format custom that allows you to generate, well, custom logs.
According to the wiki documentation, the format for a custom log entry needs to be pipe delimited and have the following format:
# Gource sample custom log https://code.google.com/p/gource/wiki/CustomLogFormat
# minimum custom log format
1275543595|andrew|A|src/main.cpp
# optionally, we can set a color value
1275543595|andrew|A|src/main.cpp|FF0000
So this is, nice. Gource also accepts input from stdin, via - as input obviously. To sum this up. Any, correctly formatted, pipe delimited input can be accepted as a ‘log’ entry, that Gource should understand. Lets try it out.
Introducing py2gource.py
My initial thought on this was that 90% if the custom log formats could be generated on the shell. Rightfully so. With tools like awk and sed, you can do some pretty neat stuff. However, as powerful as they may be, the approach of writing some middleware that would do all of the parsing and log generation for me, seemed like a better idea. And so, py2gource.py was born. Another terribly coded piece of python to do things I am too lazy to do in any other way.
So far based on what has been coded, the basic idea to use this middleware in a very simple form is: cat something | python py2gource.py | gource
Gource for… Nmap?
But, we don’t have to cat something for output, right. Just do nmap 127.0.0.1 -v | python py2gource.py | gource. py2gource.py will happily read stdin and parse the output for input formats it understands, specified by -t as needed. For example:
# Nmap output before its parsed by py2gource.py
$ nmap 127.0.0.1 -v

Starting Nmap 6.25 ( http://nmap.org ) at 2013-07-25 19:58 SAST
Initiating Ping Scan at 19:58
Scanning 127.0.0.1 [2 ports]
Completed Ping Scan at 19:58, 0.00s elapsed (1 total hosts)
Initiating Connect Scan at 19:58
Scanning localhost (127.0.0.1) [1000 ports]
Discovered open port 8080/tcp on 127.0.0.1
Discovered open port 22/tcp on 127.0.0.1
Discovered open port 80/tcp on 127.0.0.1
Discovered open port 3306/tcp on 127.0.0.1
Discovered open port 5222/tcp on 127.0.0.1
[...]

# now, parsed by py2gource.py
$ nmap 127.0.0.1 -v | python py2gource.py -t nmap

1374774922|nmap|A|127.0.0.1/tcp/8080|9C9841
1374774922|nmap|A|127.0.0.1/tcp/22|9C9841
1374774922|nmap|A|127.0.0.1/tcp/80|9C9841
1374774922|nmap|A|127.0.0.1/tcp/3306|9C9841
1374774923|nmap|A|127.0.0.1/tcp/4000|9C9841
From the above example we can see that the verbose Nmap output has been parsed to be complaint to the custom log format as per the Gource wiki. So, lets pipe this to gource:
# Nmap to gource
$ nmap -v 192.168.137.0/24 | python py2gource.py -t nmap | gource --realtime --log-format custom - -1440x900 --bloom-intensity 0.3 -e 0.2 -i 120 --title "Nmap of 192.168.137.0/24"
You should now have a Gource window pop up, with your Nmap results being displayed in a similar fashion as you saw in the Minecraft example. The above command completes the 3 parts required to get output to Gource using the middleware. Granted in the Nmap case, the parser will just not output anything if the IP or IP range that you are scanning has no open ports, or, you forgot to specify the -v argument. This requirement may change later.
Seeing the Nmap scan come alive is pretty cool. It almost convinces one to scan all the things, just to watch the pretty pictures!
Visualising a Network Telescope
Where I am currently employed, I am fortunate enough to have access to the data our blackhole provides to us. The setup is pretty simple. There are 13, random /24’s (IPV6 coming soon™), sink holed to a box running the Argus server software. Argus provides a set of client tools that you can use to connect to the server and ‘see’ what is happening, live.
This was a golden opportunity to add a parser that would parse the output this client receives into Gource. The result? See for yourself:
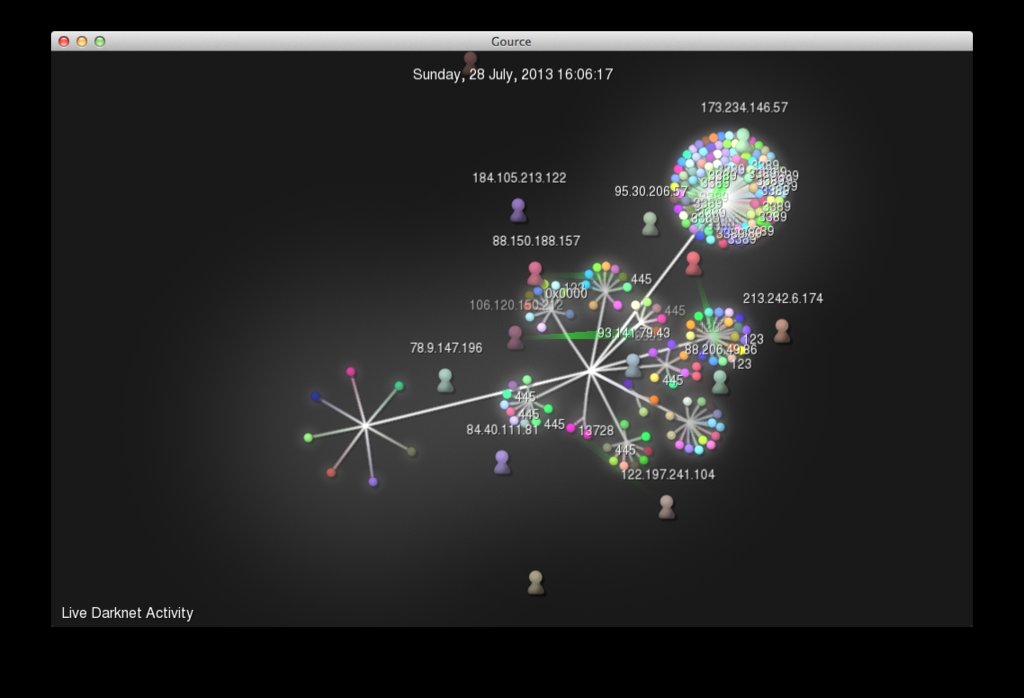
Moments later, even more activity… :)
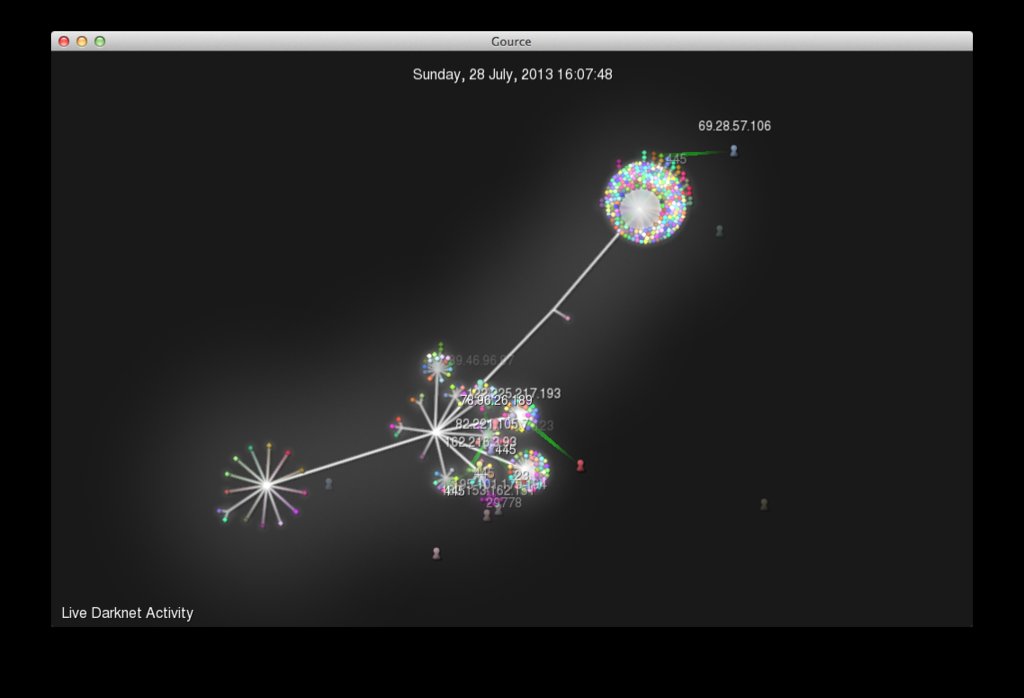
The parser will take the Argus client output and split the results of the IPv4 destination address by octet. Each octet will form part of the tree structure. Each bubble represents a port that was touched. Finally, each full destination IP address will get its own unique colour, so it will be easy to see when a specific IP has been scanned across multiple ports. Each user is a source IP address. Remember, this is IP space that is used for nothing other than seeing what is happening on it. So things like people scanning your Darknet for open SSH ports will make your Gource go mad, in a good way ofc.
The above screenshots were taken by specifying the --hide dirnames arguments, as we obviously want to try and keep the IP space of the blackhole classified.
Ok, how did you do THAT
# Visualising the Argus Darknet with Gource
$ ra -S [argus_server]:[argus_port] -n | tee raw | python py2gource.py -t argus | tee parsed | gource --realtime --log-format custom - -1440x900 --bloom-intensity 0.3 --title "Live Darknet Port Activity" -i 30 -f
I am going to assume you have the Argus server setup complete, and you are able to connect using the ra client. For more information on setting it up, refer to the Argus wiki here. Which ever machine your using to run Gource on, obviously needs to be able to connect as well.
The Argus parser works without specifying any fancy command line options. I have used -n in the example as I did not want to have the destination port names, but the raw port numbers instead. This output is piped into tee, that will write the output to the file raw as well as stdout. This is not a requirement, but its interesting to see what is being parsed. I tail the file in a separate terminal usually and inspect the output. Then the output is passed to py2gource.py with the type set to argus via -t argus. The output generated by this middleware is then finally ‘tee’d’ and sent to Gource, which is configured to accept input in realtime from stdin with --realtime --log-format custom -. The rest of the options I used in the example for Gource is purely graphically related.
The file parsed can be seen as a ‘history’ file that can be piped into Gource again at a later time to replay potentially interesting events, or, if you are not able to connect directly to argus, and need to grab and parse output on one machine, and then replay on another machine with Gource installed.
Get the code, setup your own.
The parser’s code is hosted on Github here. Grab the code with git clone https://github.com/leonjza/py2gource.git. Parsers live in lib/Parsers if you are interested in parsing some other interesting information you may have.
Have fun! :D